Runescape Market Analysis (Part 2): Analyzing the Data
This is part 2 of a 3 part series on my attempt to accurately predict future prices of items on the Runescape Grand Exchange.
And in case you didn't see it in part 1, here's the end result of this entire endeavor: A twitter bot that tweets about items projected to increase in price on the Grand Exchange within the next 20 days.
At the end of part 1 I gathered 3 years worth of historical data by scraping Grand Exchange Watch and stuck it in a set of CSV files. Each row of one of the CSV files is 1 unix date stamp, and 1 price of the item on that date. Like so:
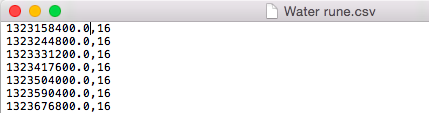
Simple enough. So I have this rather long data file, now what?
I need a way to go through this collection and collect patterns of price changes. I think 20 days is quite enough time for a price movement to occur, so I'll make all the patterns 20 points long. I'll start with an "anchor" point, and iterate through the next 20 price points, taking the percentage change between the anchor point and each point after it, up to 20. At this point I'll move the anchor 1 down the list and do the same. In the end there will be as many patterns as there are data-points, minus 20 (I don't want the most recent 20 days to be included in the pattern collection).
First things first, I need a percentage change function:
def percentChange(startPoint, currentPoint):
    try:
        x = ((currentPoint - float(startPoint)) / abs(startPoint)) * 100
        if x == 0.0:
            return 0.00000000001
        else:
            return x
    except:
        return 0.00000000001
If there is no change between the two points I'm working with I don't want the function to return exactly 0, as that ends up causing the code to return some errors later on (I'm not entirely sure why). So 0.00000000001 is close enough to 0.0 to work. Getting exactly 0 is rare enough that it's not really an issue anyway.
Okay, so now on to collecting the patterns. The following code does exactly as I described above.
def patternStorage():
    x = len(item_price) - 20

    y = 20
    #I don't want to gather the most recent 20 items, thus if y < x:

    while y < x:
        pattern = []
        patStartTime = time.time()

        ## Steps to gathering the pattern ##

        ####################################

        #The following collects 20 points of pattern data

        #1) Starting at y-20 (y starts at 20 so: 20-20 = 0)

        #2) Get the percentChange from y-20 (0) to y-19 (1)

        #   Then the percent change from y-20 (0) to y-18 (2)

        #   etc.

        #3) Append p1 through p20 to a list (list of lists)

        #4) The outcome range is the NEXT 20 items after y,

        #   The average outcome is the average of those

        #   The performance array is a list of all these averages

        #5) y+1

        #6) Start over with the next Y value (21-20=1)

        #7) Compare it to Y-19 (21-19=2) I.E. Percent change from 1 to 2


        p1 = percentChange(item_price[y-20], item_price[y-19])
        p2 = percentChange(item_price[y-20], item_price[y-18])
        p3 = percentChange(item_price[y-20], item_price[y-17])
        p4 = percentChange(item_price[y-20], item_price[y-16])
        p5 = percentChange(item_price[y-20], item_price[y-15])
        p6 = percentChange(item_price[y-20], item_price[y-14])
        p7 = percentChange(item_price[y-20], item_price[y-13])
        p8 = percentChange(item_price[y-20], item_price[y-12])
        p9 = percentChange(item_price[y-20], item_price[y-11])
        p10 = percentChange(item_price[y-20], item_price[y-10])
        p11 = percentChange(item_price[y-20], item_price[y-9])
        p12 = percentChange(item_price[y-20], item_price[y-8])
        p13 = percentChange(item_price[y-20], item_price[y-7])
        p14 = percentChange(item_price[y-20], item_price[y-6])
        p15 = percentChange(item_price[y-20], item_price[y-5])
        p16 = percentChange(item_price[y-20], item_price[y-4])
        p17 = percentChange(item_price[y-20], item_price[y-3])
        p18 = percentChange(item_price[y-20], item_price[y-2])
        p19 = percentChange(item_price[y-20], item_price[y-1])
        p20 = percentChange(item_price[y-20], item_price[y])

        #How far ahead to look

        outcomeRange = item_price[y+1:y+21]
        currentPoint = item_price[y]

        try:
            #The average % change increase/decrease for the next 20 days

            avgOutcome = reduce(lambda x,y: x+y, outcomeRange/len(outcomeRange))
        except Exception, e:
            print str(e)
            avgOutcome=0

        futureOutcome = percentChange(currentPoint, avgOutcome)

        pattern.append(p1)
        pattern.append(p2)
        pattern.append(p3)
        pattern.append(p4)
        pattern.append(p5)
        pattern.append(p6)
        pattern.append(p7)
        pattern.append(p8)
        pattern.append(p9)
        pattern.append(p10)
        pattern.append(p11)
        pattern.append(p12)
        pattern.append(p13)
        pattern.append(p14)
        pattern.append(p15)
        pattern.append(p16)
        pattern.append(p17)
        pattern.append(p18)
        pattern.append(p19)
        pattern.append(p20)

        patternAr.append(pattern)
        performanceAr.append(futureOutcome)

        y+=1
A note about the above code: Yes. It should be written with a loop or otherwise shortened. The primary reason it is written so repetitively is for the sake of learning and for my own understanding. Writing it like this makes it abundantly clear what the patterns consist of.
I'm also going to need to do the same thing for the most recent pattern (the last 20 items in the CSV). Luckily I only need to do this once, so no for loop this time.
def currentPattern():
    #Starting at index -20 is starting 20 items in the past

    #It goes all the way to index -1, which is the most recent item in the price list


    cp1 = percentChange(item_price[-21], item_price[-20])
    cp2 = percentChange(item_price[-21], item_price[-19])
    cp3 = percentChange(item_price[-21], item_price[-18])
    cp4 = percentChange(item_price[-21], item_price[-17])
    cp5 = percentChange(item_price[-21], item_price[-16])
    cp6 = percentChange(item_price[-21], item_price[-15])
    cp7 = percentChange(item_price[-21], item_price[-14])
    cp8 = percentChange(item_price[-21], item_price[-13])
    cp9 = percentChange(item_price[-21], item_price[-12])
    cp10 = percentChange(item_price[-21], item_price[-11])
    cp11 = percentChange(item_price[-21], item_price[-10])
    cp12 = percentChange(item_price[-21], item_price[-9])
    cp13 = percentChange(item_price[-21], item_price[-8])
    cp14 = percentChange(item_price[-21], item_price[-7])
    cp15 = percentChange(item_price[-21], item_price[-6])
    cp16 = percentChange(item_price[-21], item_price[-5])
    cp17 = percentChange(item_price[-21], item_price[-4])
    cp18 = percentChange(item_price[-21], item_price[-3])
    cp19 = percentChange(item_price[-21], item_price[-2])
    cp20 = percentChange(item_price[-21], item_price[-1])


    patForRec.append(cp1)
    patForRec.append(cp2)
    patForRec.append(cp3)
    patForRec.append(cp4)
    patForRec.append(cp5)
    patForRec.append(cp6)
    patForRec.append(cp7)
    patForRec.append(cp8)
    patForRec.append(cp9)
    patForRec.append(cp10)
    patForRec.append(cp11)
    patForRec.append(cp12)
    patForRec.append(cp13)
    patForRec.append(cp14)
    patForRec.append(cp15)
    patForRec.append(cp16)
    patForRec.append(cp17)
    patForRec.append(cp18)
    patForRec.append(cp19)
    patForRec.append(cp20)
In case you're wondering why I take the percent change of everything in both of these functions: It's because I have to normalize the patterns. Otherwise if an item used to fluctuate around 100gp, but now fluctuates around 200gp, this won't pick up on those patterns.
Next up I have to figure out how similar the current pattern is to all the other patterns in my dataset
def patternRecognition():

    predictedOutcomesAr = []
    patFound = 0
    plotPatAr = []


    #For each pattern in the full pattern list, check each point in that pattern

    #against the corresponding point in the current pattern

    #Example: if the % change between one point in a historical pattern and the

    #corresponding point in the current pattern is 2% then they are 98% similar

    #at that point


    for eachPattern in patternAr:
        sim1 = 100.0 - abs(percentChange(eachPattern[0], patForRec[0]))
        sim2 = 100.0 - abs(percentChange(eachPattern[1], patForRec[1]))
        sim3 = 100.0 - abs(percentChange(eachPattern[2], patForRec[2]))
        sim4 = 100.0 - abs(percentChange(eachPattern[3], patForRec[3]))
        sim5 = 100.0 - abs(percentChange(eachPattern[4], patForRec[4]))
        sim6 = 100.0 - abs(percentChange(eachPattern[5], patForRec[5]))
        sim7 = 100.0 - abs(percentChange(eachPattern[6], patForRec[6]))
        sim8 = 100.0 - abs(percentChange(eachPattern[7], patForRec[7]))
        sim9 = 100.0 - abs(percentChange(eachPattern[8], patForRec[8]))
        sim10 = 100.0 - abs(percentChange(eachPattern[9], patForRec[9]))
        sim11 = 100.0 - abs(percentChange(eachPattern[10], patForRec[10]))
        sim12 = 100.0 - abs(percentChange(eachPattern[11], patForRec[11]))
        sim13 = 100.0 - abs(percentChange(eachPattern[12], patForRec[12]))
        sim14 = 100.0 - abs(percentChange(eachPattern[13], patForRec[13]))
        sim15 = 100.0 - abs(percentChange(eachPattern[14], patForRec[14]))
        sim16 = 100.0 - abs(percentChange(eachPattern[15], patForRec[15]))
        sim17 = 100.0 - abs(percentChange(eachPattern[16], patForRec[16]))
        sim18 = 100.0 - abs(percentChange(eachPattern[17], patForRec[17]))
        sim19 = 100.0 - abs(percentChange(eachPattern[18], patForRec[18]))
        sim20 = 100.0 - abs(percentChange(eachPattern[19], patForRec[19]))
        #Note this is where a some error might appear in the algorithm, as

        #it's taking a percent change of a percent change. Not great.


        #average of all the sims above

        howSim = (sim1 + sim2 + sim3 + sim4 + sim5 + sim6 + sim7 + sim8 + sim9 + sim10+
 sim11 + sim12 + sim13 + sim14 + sim15 + sim16 + sim17 + sim18 + sim19 + sim20) / 20.0

        if howSim > 75:
            patFound = 1
            xp = range(1, 21)
            similarPatterns.append(eachPattern)

        #As long as one pattern is found that is 75% similar or higher

        if patFound == 1:
            #Take each one of those patterns

            for eachpatt in similarPatterns:
                #Find its index in our complete list of patterns

                futurePoints = patternAr.index(eachpatt)
                #put the corresponding outcome into the predictedOutcomesAr list

                predictedOutcomesAr.append(performanceAr[futurePoints])
                #If it's greater than the current point

                if performanceAr[futurePoints] > patForRec[19]:
                    #Increase positive outcomes by 1

                    positiveOutcomes += 1


            #Take the average of all our predicted outcomes

            predictedAvgOutcome = reduce(lambda x, y: x+y, predictedOutcomesAr) / len(predictedOutcomesAr)

            #If on average the outcome will be greater than the current price

            if predictedAvgOutcome > patForRec[19]:
                positive = 1
                OutcomePrediction = predictedAvgOutcome
With this function I have iterated through all the patterns in our CSV, and I have compared them with the most recent pattern. For all the patterns that are >75% similar, I add them to a list called similarPatterns.
I then average the historical outcomes of each entry in similarPatterns, and if the average is greater than the current price of the item, I label the item as having a net positive prediction.Additionally, I count the number of positive outcomes from the similarPatterns list. This gives me a couple of variables that describe the total number of similar positive outcomes and whether or not the average outcome is predicted to be positive.
And that pretty much completes the analysis. Now I just have to decide if I want to count this particular item as "interesting" or not. And of course I have to call the previous 3 functions in the proper order to do so.
#setting global variables

interestingItems = []
item_names = {}
patternAr = []
performanceAr = []
patForRec = []
positiveOutcomes = 0
positive = 0
OutcomePrediction = 0

#Uses the getItemNames function from part 1

getItemNames(item_ids)

#Runs all the steps of our pattern analysis in the proper order

def Analyze():
    patternStorage()
    currentPattern()
    patternRecognition()

    #Determines whether to add an item to our "interesting items" list

    #Also calculates by how many percentage points the price will rise

    if positiveOutcomes > 1 and positive == 1:
        priceChangePercent = int(abs(patForRec[19]-OutcomePrediction))/100.0
        newPrice = ((priceChangePercent)*item_price[-1]) + item_price[-1]
        interestingItems.append(str(item_names[item]) + "," + str(item) + "," + str(item_price[-1]) + "," + str(priceChangePercent) + "," + str(newPrice))

    #Clears global variables

    patternAr[:] = []
    performanceAr[:] = []
    patForRec[:] = []
    positiveOutcomes = 0
    positive = 0
This Analyze function will do everything I need to do for each item. I made a function out of it since I'm going to be calling it for every CSV file I gathered in part 1. Like so:
for item in item_names:
    datestamp, gold = np.loadtxt(str(item_names[item])+".csv", unpack=True,
 delimiter=',')
    item_price = gold
    Analyze()
And finally I create a CSV file that contains all of the items of interest based on the analysis.
f = open('ItemsOfInterest.csv', 'w+')
for item in interestingItems:
	f.write(str(item)+'\n')
f.close()
And there we have it, a (messy) script that will scan for and save items that might be increasing in price in the next 20 days.
Again, if you have suggestions for improving the code, or questions about how it works go ahead and leave a comment or shoot me an email.
In part 3 I discuss how I update the CSV with the current day's price, and how I set up the twitter bot.
Thanks for reading!